CVIRL · Aortic root tracking
Aortic root tracking
Does the aortic-root tracker have a bug, or is this the algorithm?
A side-by-side of the original command-line pipeline against the GUI, on the same murine series, to answer one question cleanly.
Bottom line. This is not a bug introduced by the GUI — the original command-line code and the GUI share the same tracking math and produce the same result. But on this low-contrast murine data the tracking has real accuracy limits: it drifts off the walls when it moves smoothly, or freezes and jumps when tracked in cardiac-phase order. That is the algorithm's ceiling on this image quality, not a fixable defect or a bad parameter.
What the comparison shows
No regression was introduced by the GUI. The core routines match the original line for line: the cost function, the search-box updates, the bounds, the optimizer settings, the coordinate transforms. Same input gives the same result, and the tracker is deterministic. The behavior is inherited from the original, not created by the refactor.
The tracker follows real vessel motion, and removes it. Across the clip it accounts for a few hundred pixels of translation. That is genuine breathing and probe motion, and once removed the vessel sits steady. This is the tracker working, not diverging.
The flip matters for the original tool. The command-line version only completes if the contour is drawn in one orientation; the mirrored draw errors out during setup. The GUI already handles both automatically, so this is a non-issue there.
The tool's own output
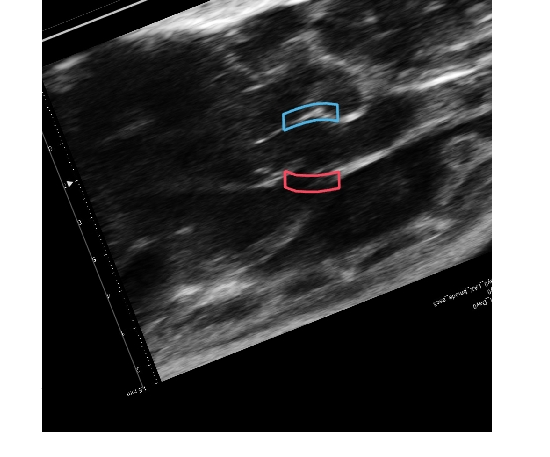
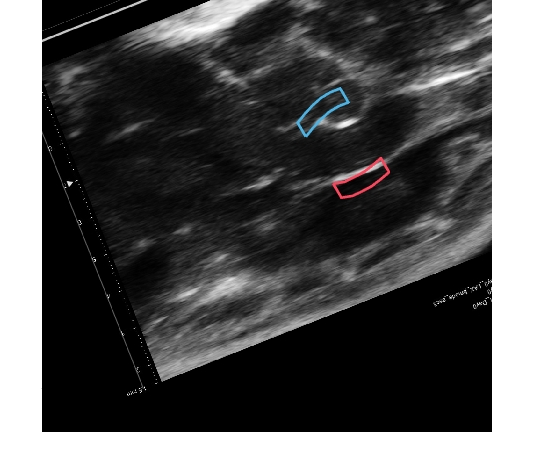
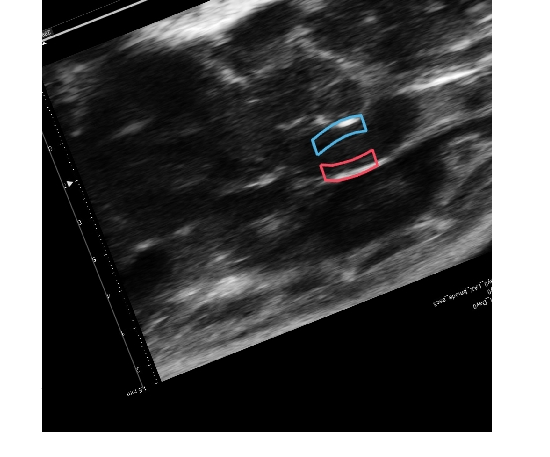
Sorted vs unsorted: two different failure modes
Marking the cardiac events and re-tracking in heartbeat-phase order was expected to help. In still frames it looks like it does — the sorted borders sit nearer the walls than an unsorted pass (below). But watching the actual motion tells a different, more honest story, and it is the important finding.
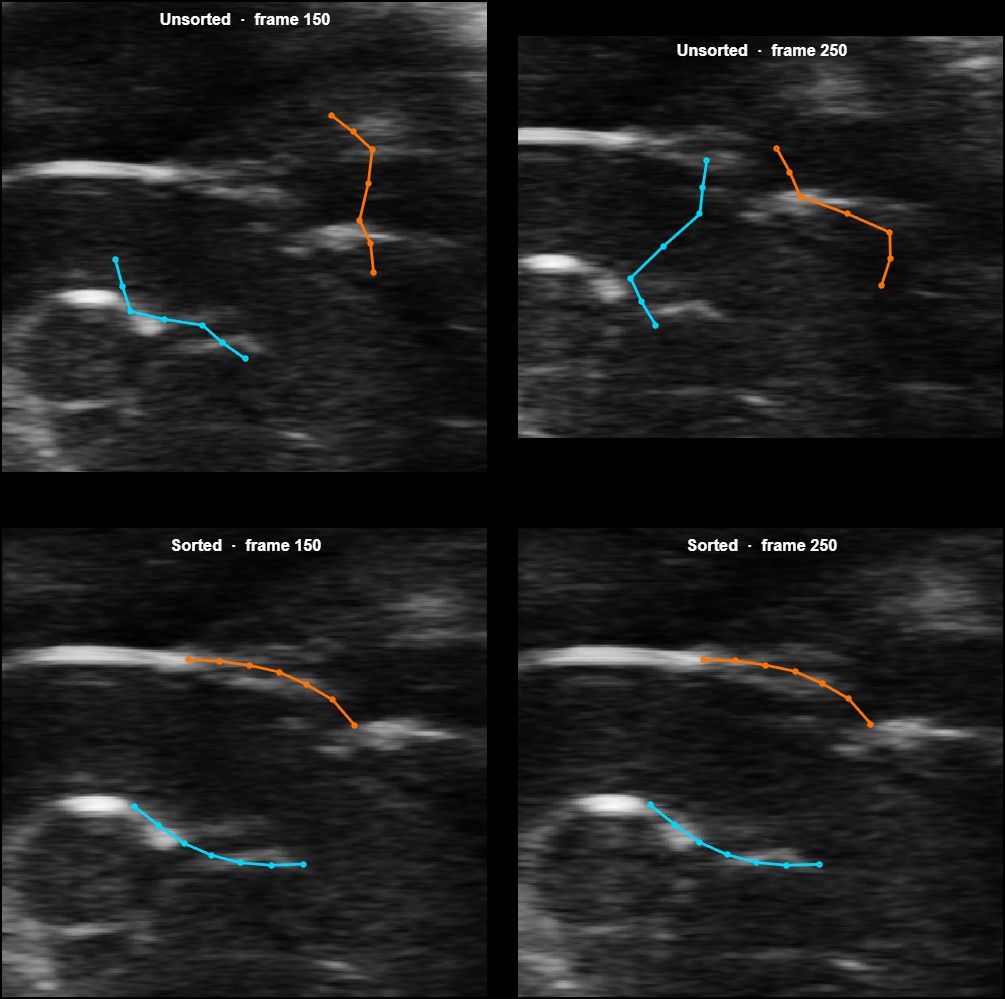
The motion is the point, so here are both tracked the whole clip (borders overlaid on the moving image):
In motion, neither pass is clean, and they fail in opposite ways:
- Unsorted moves smoothly frame to frame (largest step ~21 px, nothing frozen) but drifts off the walls over the clip.
- Sorted sits nearer the walls per frame but its motion freezes on ~23% of frames and then jumps (up to ~106 px between consecutive frames). That is the reordering artifact of phase-sorted tracking, made worse by the optimizer failing to improve on low-contrast mouse frames.
So the phase-sorting trades smooth-but-drifting for on-wall-but-jumpy. It is not a clean win. This points at the parametric tracker's ceiling on this image quality, not at a fixable parameter.
A display bug was also found and fixed along the way: the tool's live preview drew borders without each frame's tracked motion, which had hidden the jumpiness (it made everything look frozen-in-place). With that corrected, the preview now shows the true motion — which is how the freeze/jump behavior became visible.
Scope and next steps
On measurement — a caution. A per-frame brightness proxy put the sorted borders "on the walls" ~90% of the time, but that proxy only checks each frame's position and misses the temporal freezing/jumping shown above, so it overstated quality. A meaningful accuracy read has to judge the motion against a gold-standard reference curve and a trained eye — that remains open, and it is where the real question lives.
Built and ready to try. Resetting the tracking reference frame to the end-diastole cardiac event (a cleaner, phase-locked anchor) is now a one-click option in the tool. The mechanism is in place and verified; whether it meaningfully helps on this image quality is unproven and needs judging on real data.
The honest read. The most useful conclusion is not "which pass wins" but that the parametric tracker is near its ceiling on murine contrast — smooth-but-drifting or on-wall-but-jumpy are two faces of the same limit. Pushing accuracy further likely means a different approach (per-frame wall segmentation), not more tuning of this one.
Caveat. Based on one series so far, from a freshly drawn contour. Worth confirming on a couple more before treating it as final.
A per-frame wall detector for the aortic root
Last week's assessment showed the current tracker drifts, and in the back third of each clip collapses, with the two walls crossing over each other. This week is a different method that does not have those failure modes and follows the walls accurately.
Bottom line. Detecting each wall freshly on every frame, then fitting it to a smooth curve, tracks both walls on the bright wall pixels as clean curves, with no drift and no collapse. Pulled into a measurement, the wall separation over time recovers the beat-to-beat cardiac oscillation that the old tracker destroyed. It holds on a second animal with no settings changed, where it beats at a correct mouse heart rate while the old tracker collapses again. It is not finished (roughly a fifth of frames are interpolated, and the measurement still spikes on the faint frames), but it clearly works on the data that breaks the current tracker.
What the technique is, and how it works
It is per-frame wall detection using dynamic-programming layer tracing, the same approach used to trace tissue layers in retinal OCT scans. Each frame is solved entirely on its own:
- Look only inside the aortic root. The trace is bounded to the root's own extent, so it cannot follow a brighter neighbouring structure (the ascending aorta, the mitral valve) off the root. This matters because the ascending aorta wall is often brighter than the root, and a brightest-path detector would otherwise drift onto it.
- Trace each wall as the brightest continuous path. The blood pool is dark and the walls are bright. Dynamic programming finds the single brightest line that runs smoothly across the width, so it locks onto one real bright structure and cannot jump to stray speckle.
- Trim to the real wall. Each line is cut back to where it is genuinely bright, so it stops at the wall's end instead of running off.
- Fit a smooth curve and steady it. Each wall is fit to a smooth curve so it reads as a clean arc rather than a noisy line, and a short symmetric temporal filter over neighbouring frames stops it flickering.
Nothing is carried forward between frames, no previous position and no template. That is the whole point: with nothing to accumulate, the drift and the wall-crossing collapse cannot happen. The temporal filter is symmetric and short (it uses past and future frames in a fixed window), so it steadies the curves without reintroducing that accumulation.
The result
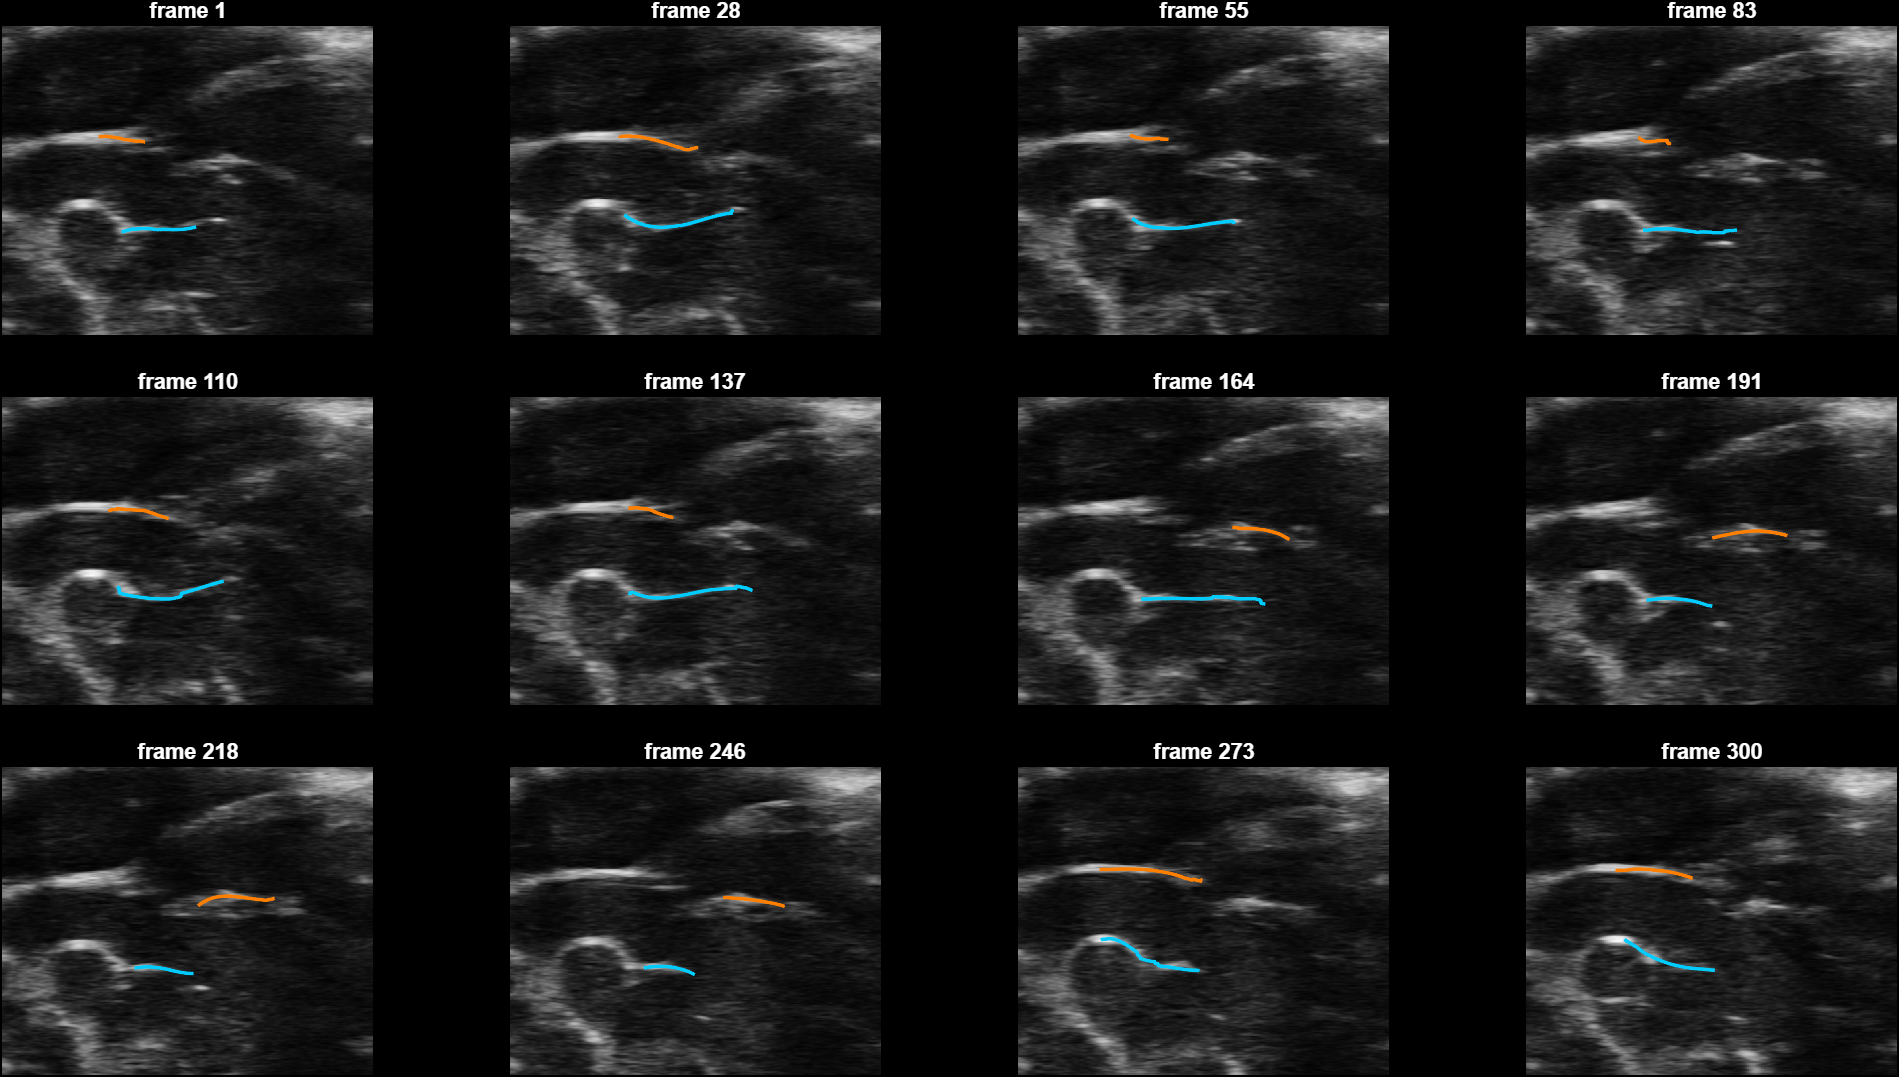
The diameter over time
Pulling a measurement out of it: the vertical separation between the two walls, frame by frame.
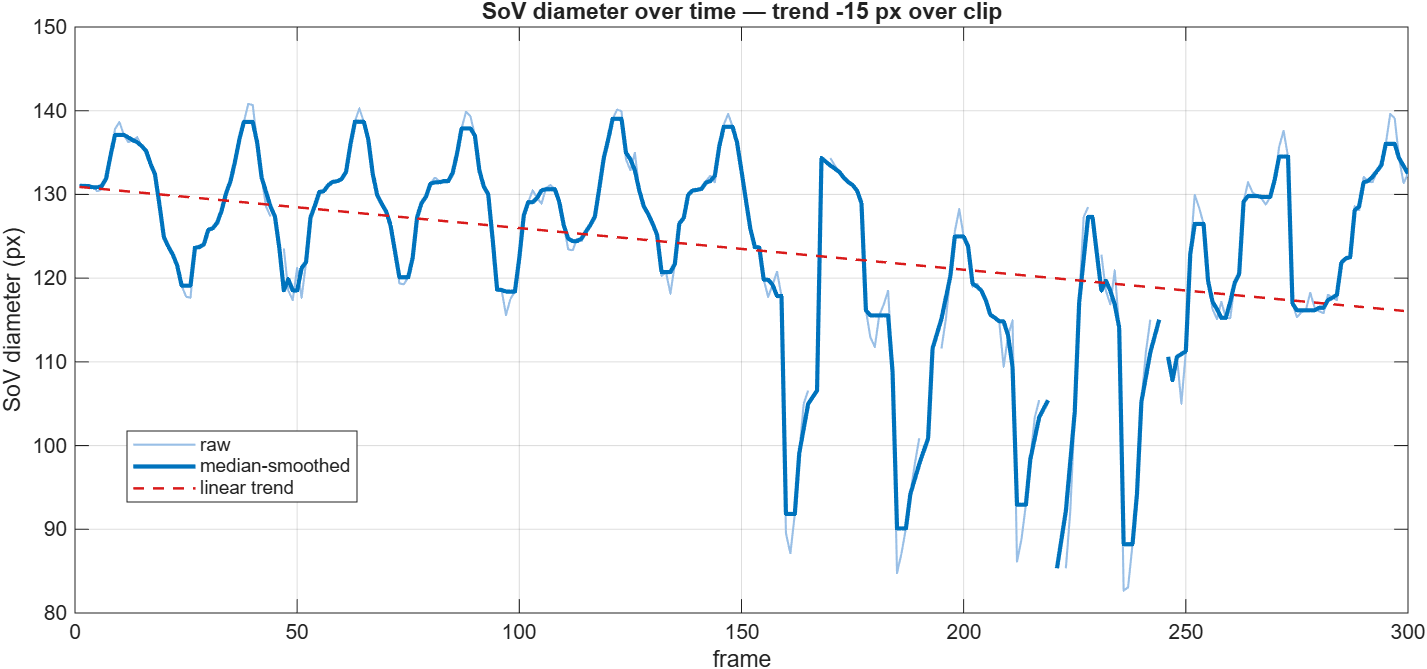
Three things to read here. The repeating rise and fall is the cardiac cycle, about twelve beats across the clip, expanding and contracting the root, and the per-frame detector recovers it where the old collapsing tracker could not. The sharp dips are the faint frames where detection wobbles, the same frames that get interpolated. And the slow downward trend is modest, about 12% over the whole clip. On temporal drift, which is a fair concern: because each frame is detected independently with no memory, this method cannot accumulate drift the way a frame-to-frame tracker does, so that trend is either real motion of the imaging plane or a slow systematic bias, not runaway error.
A second animal
The same detector, with no settings changed, run on ATAA03 Day 0: a different mouse, contoured and tracked the normal way.
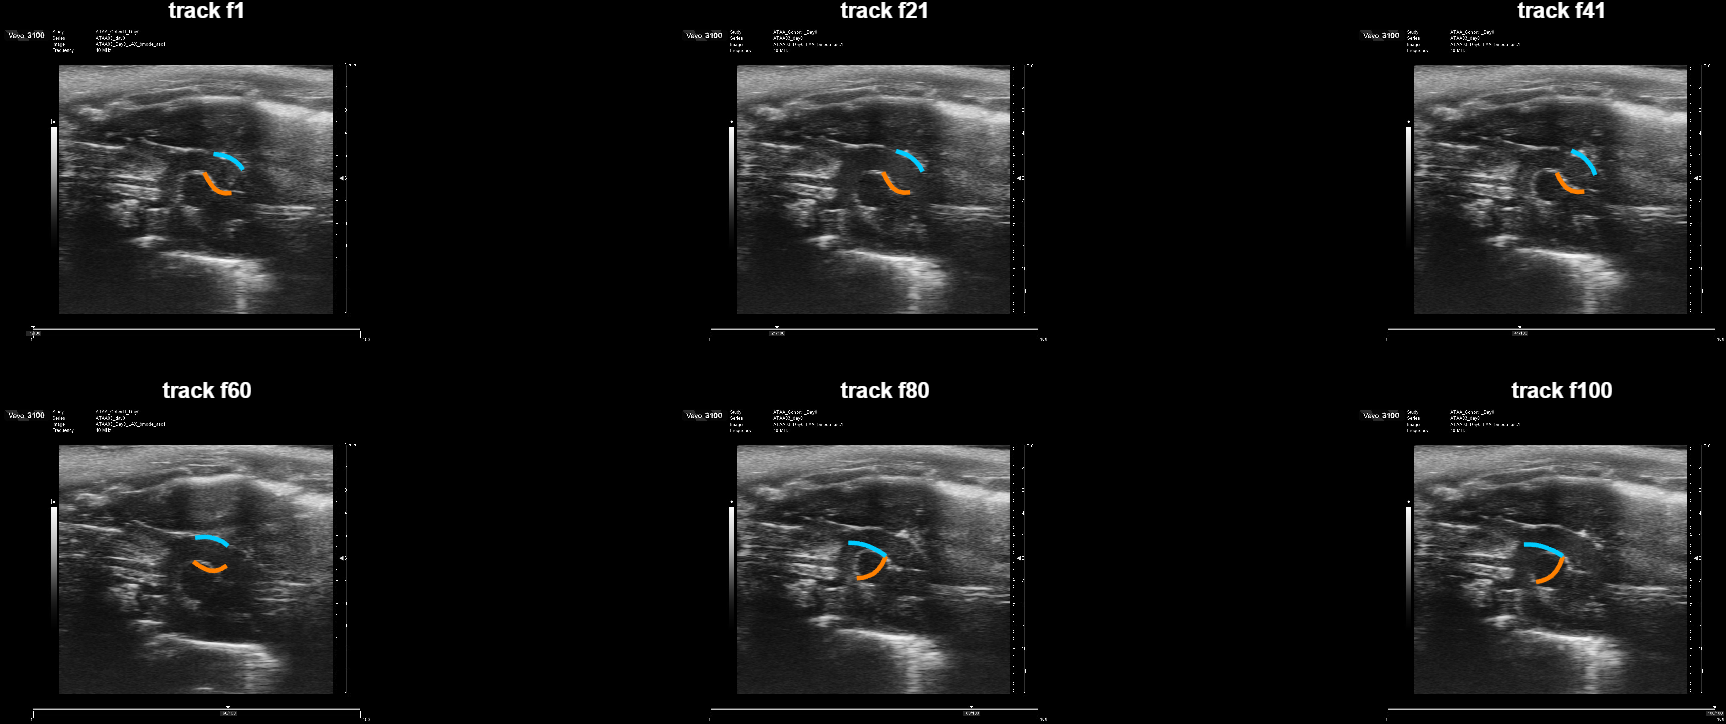
Running the detector here required one change: it previously took its search region from the tracked positions, which is useless when the track is bad. It now anchors on the hand-drawn contour, and each frame locates the vessel itself. So it needs no tracking step at all, which is both what made this file usable and what a deployable tool needs.
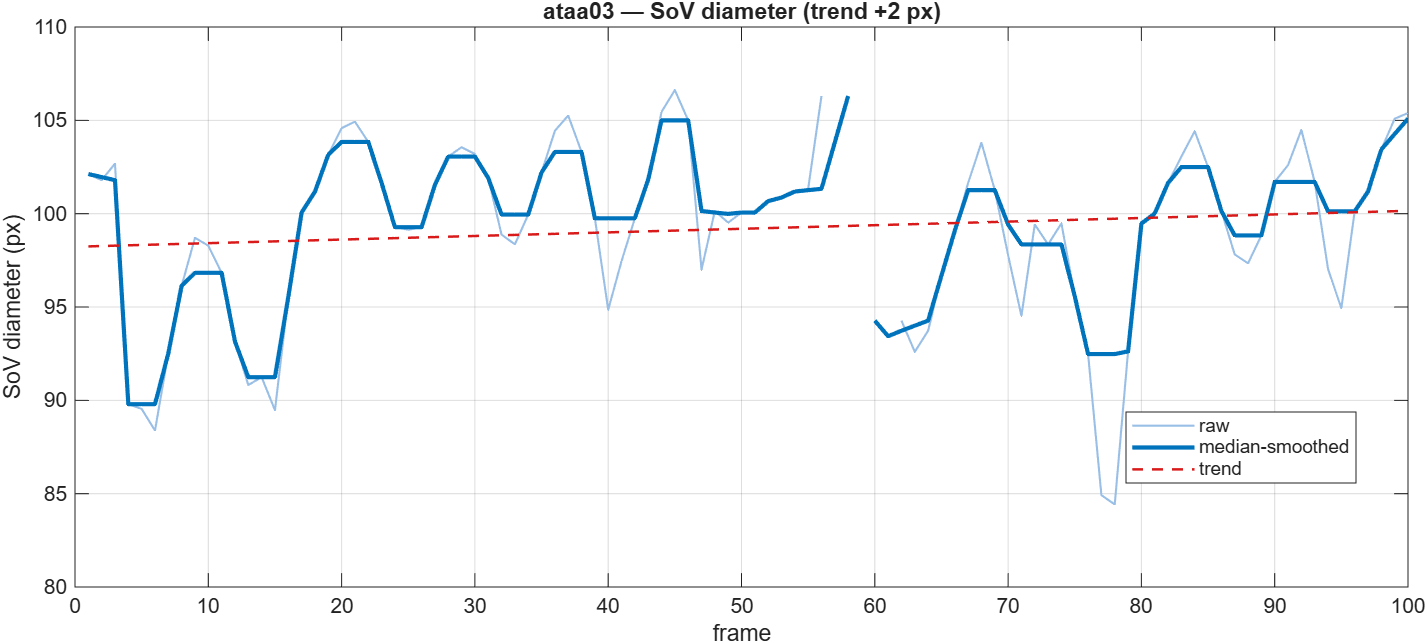
Two independent checks support that trace. Its median diameter, 100 px, agrees closely with the tracker's own estimate of 97 px from a completely different method. And the oscillation rate lands in the mouse cardiac band: at this file's 70.4 Hz, three different counting methods put it between 340 and 465 bpm, normal for an anesthetized mouse. The methods disagree by more than they do on the first file, so treat the rate here as approximate. The point that holds is that the trace is beating at a physiological rate, a check the method could have failed and did not.
| ATAA01 · Day 0 | ATAA03 · Day 0 | |
|---|---|---|
| Diameter (median) | 125 px | 100 px |
| Drift across clip | −12% | +2% |
| Frames interpolated | 17% | 21% |
| Drift or collapse | none | none |
In real units
The scan carries its own pixel scale, so the trace converts to millimetres: 0.0118 mm per pixel on the first file, 0.0150 on the second. Applying each file's own scale:
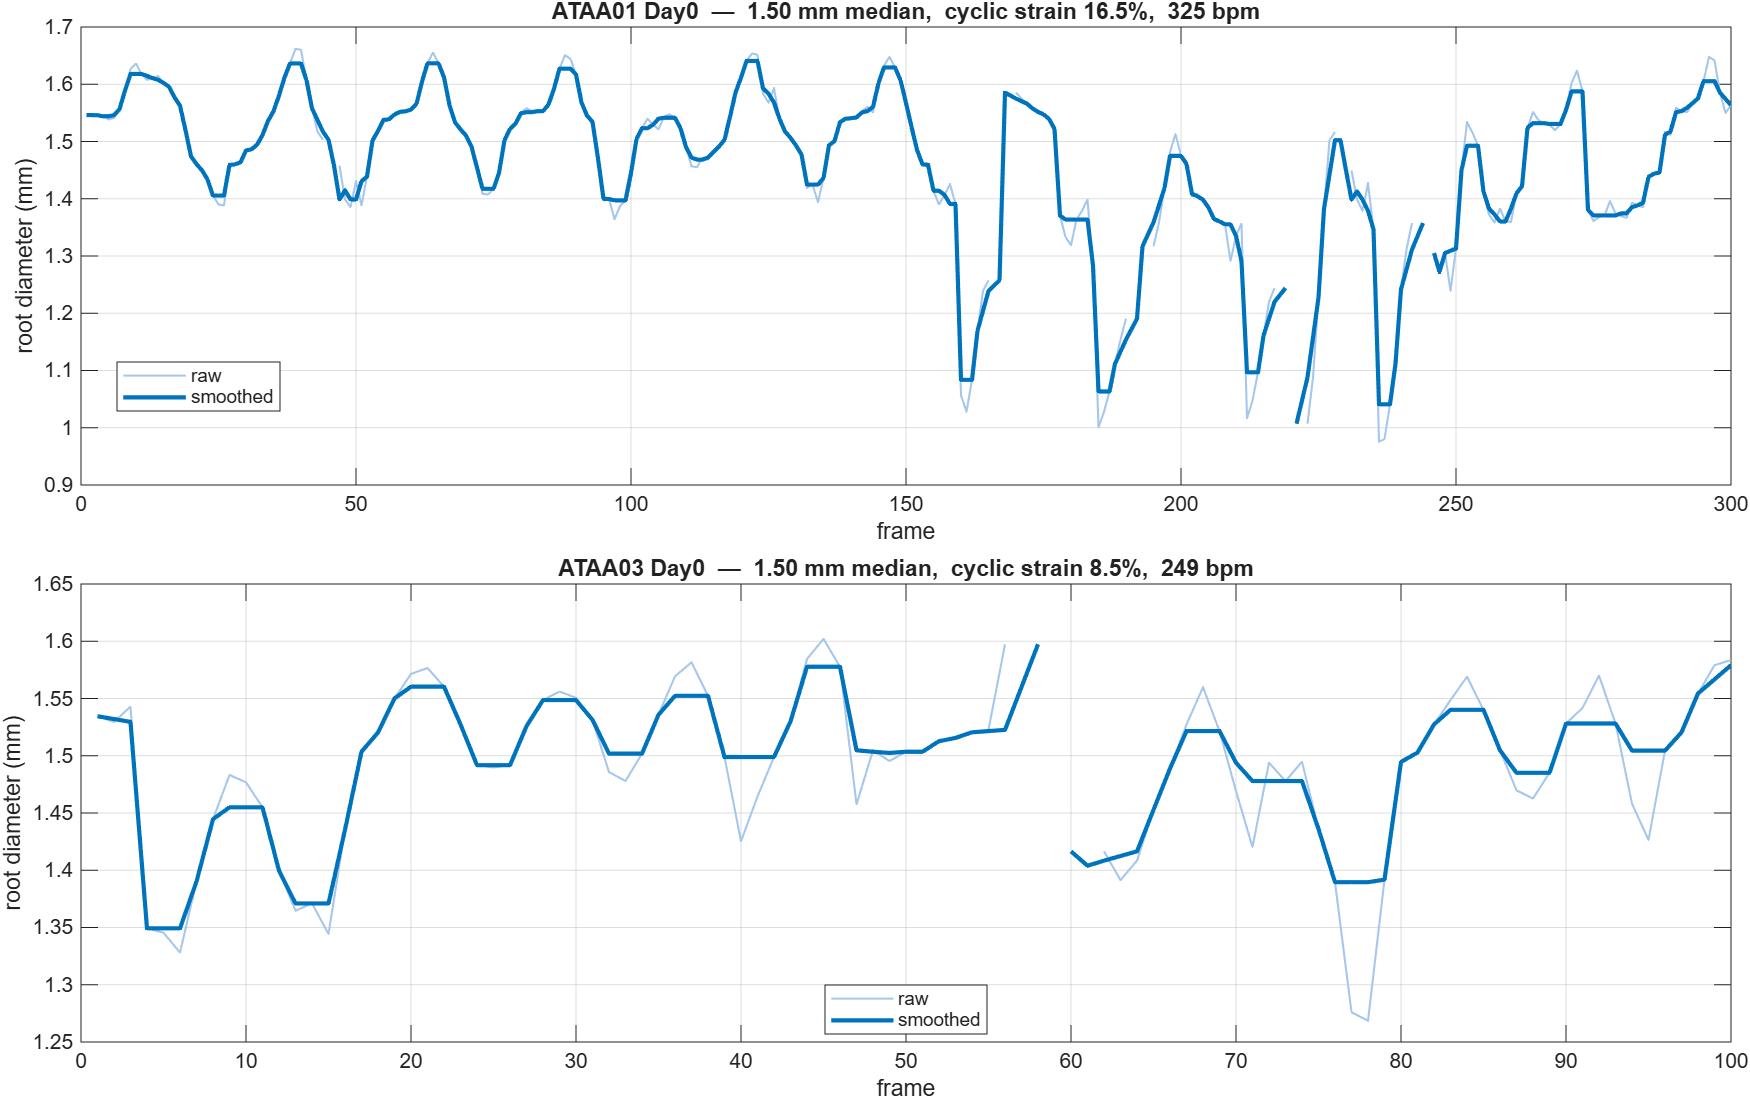
The numbers land in the right range. An adult mouse aortic root runs roughly 1.3 to 1.8 mm; measured the same way, the first animal reads 1.38 mm and the second 1.50 mm.
Getting to those numbers meant catching a real error, which is worth recording. An earlier version of this page reported both files at 1.50 mm and called it a replication. It was not: the two figures came from two different versions of the anchoring step. The fault was on the first file, where the search region was generous enough to select a dark area larger than the root, so the traces settled on structures above and below the vessel rather than on its walls. Tightening the region, and choosing the dark area by agreement with the size and position the contour implies, fixed it.
The cyclic swing, the metric the lab actually wants, is further off. The clean stretch of the first file gives about 16% strain between 1.40 and 1.63 mm, which is a sensible figure. Measured across full clips it comes out anywhere from 12% to 49%, which is not, and the upper end is not physiological. The faint frames are driving that, and they are the thing to fix before any strain number is quoted.
How these numbers were checked, and how far they can be trusted, is the following week.
Why not just fix the old tracker
We tried two ways and neither helped, because both keep the same tracker that accumulates the error. Cleaning up the image barely changed the picture. Resetting the tracker's reference at each heartbeat reproduced the same track, since the only reference available is one that has already drifted. Full detail: preprocessing and re-anchoring.
Limitations and next steps
Honest gaps. The detector fails to resolve a wall on about one frame in six, mostly the faint back-third frames, and those are currently filled by interpolation rather than true detection, so roughly a sixth of the clip is inferred, not measured. Those same frames are the sharp dips in the diameter curve, so the measurement is not yet clean enough to read a strain from directly. The detector anchors on the hand-drawn contour; a deployable tool would want its own coarse root locator, or a single click, in place of that. Two animals is a start, not a validation set.
And the numbers above are the detector's own. Nothing here shows they are correct, only that they are the right magnitude and reproduce across two scans. Checking them against a human reader, and against the animals themselves, is the following week.
Can the measurement be trusted?
Last week produced a detector that follows the root walls and returns a diameter. Whether that diameter is right had not been asked. This week answers it against walls traced by hand, puts what survived into the tool, and finds that the one thing that had been written off may not be.
In short. Three results. Diameter is measured well, agreeing with hand-traced walls to within 3% on two different animals, and it is now in the tool behind a button. The current tracker does not hold up, reporting 2.25 mm where the tracings give 1.51 and cyclic swings two to three times too large, so the tool now warns when a track has failed. And cyclic strain, which had been written off, looks measurable after all, just not on the clips it was tested on. A B-mode clip records about a dozen heartbeats and measures each one 8 times, which is too few to separate the beat from the noise. An EKV clip records one heartbeat and measures it 111 times, and on one of those the cardiac waveform comes out clean.
1. What is in the tool now
It says when a track has failed. After tracking, the two borders are checked against each other and against the drawn contour. On one file the borders have crossed by frame 193, so 49 of 300 frames report a vessel with negative width. Nothing used to notice, and those numbers flowed into Timing, M-mode and the exports as though they were real.
Diameters are in millimetres. A diameter in pixels cannot be sanity-checked by eye. In millimetres, that failed track reads 2.25 mm where a mouse root is usually 1.3 to 1.8, which announces itself without anyone measuring anything.
There is a Measure Diameter button next to Track. It runs the new detector, which reads each frame from its own pixels with nothing carried forward, so it cannot drift or collapse the way tracking does. It reports millimetres next to what the current track says for the same clip, and it refuses when it cannot read a clip, rather than returning a number nobody could tell was wrong. Below 80% of frames genuinely found, it declines.
2. The current tracker does not hold up
The tracings scored the existing tracker for the first time.
| current tracker | traced by hand | |
|---|---|---|
| first animal, diameter | 2.25 mm | about 1.51 mm |
| first animal, swing | 68% | about 20% |
| second animal, diameter | 1.45 mm | 1.53 mm |
| second animal, swing | 43% | about 22% |
Scoring it frame by frame gives errors near minus two hundred percent, which reads like a bug and is not. On the traced frames the tracker's two walls have crossed, so subtracting one from the other gives a negative number.
This matters more than a wrong number usually would, because of the direction. A stiffer aorta moves less, so strain falls as the wall degrades, and that fall is the signal of interest. A tool that overstates the movement makes a stiffening vessel look healthy, and overstates it more where the tracking is worse. The error does not average out across a study, it pushes every animal the same way.
3. Diameter is measured well
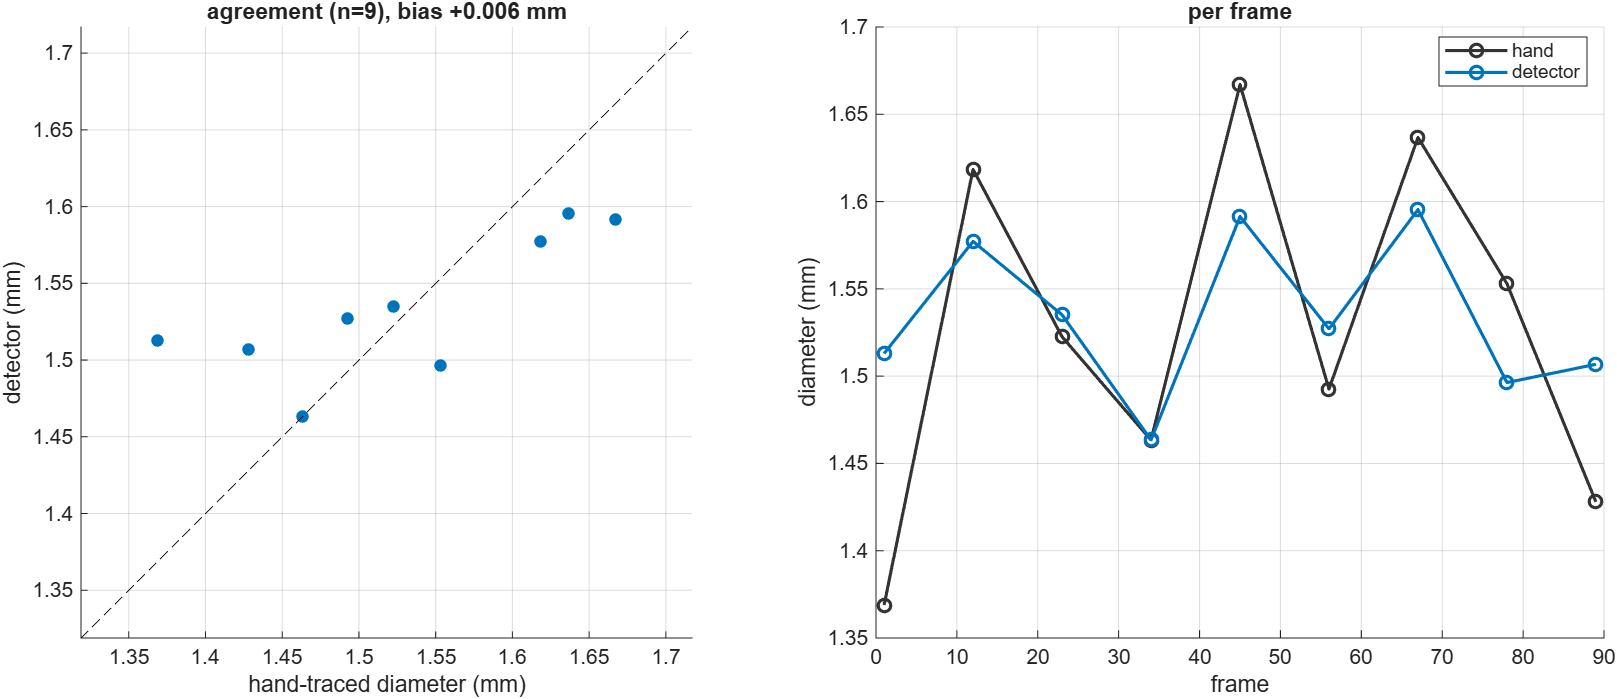
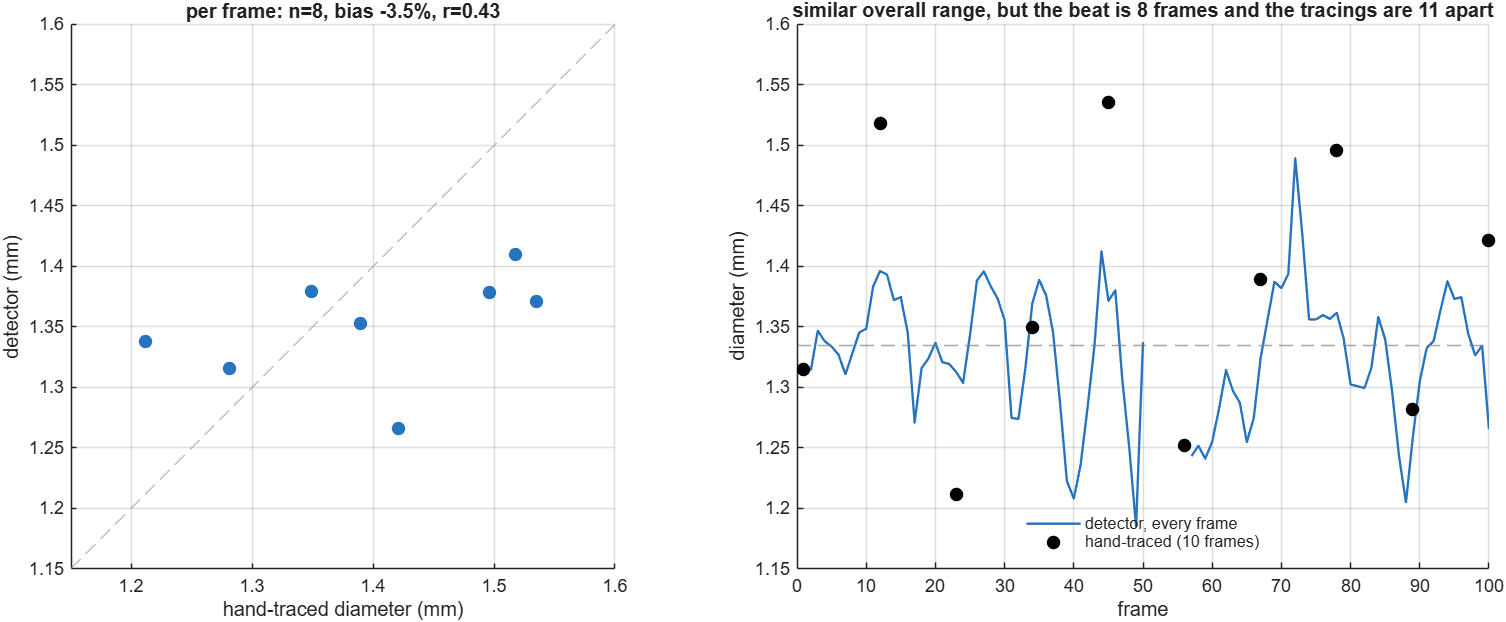
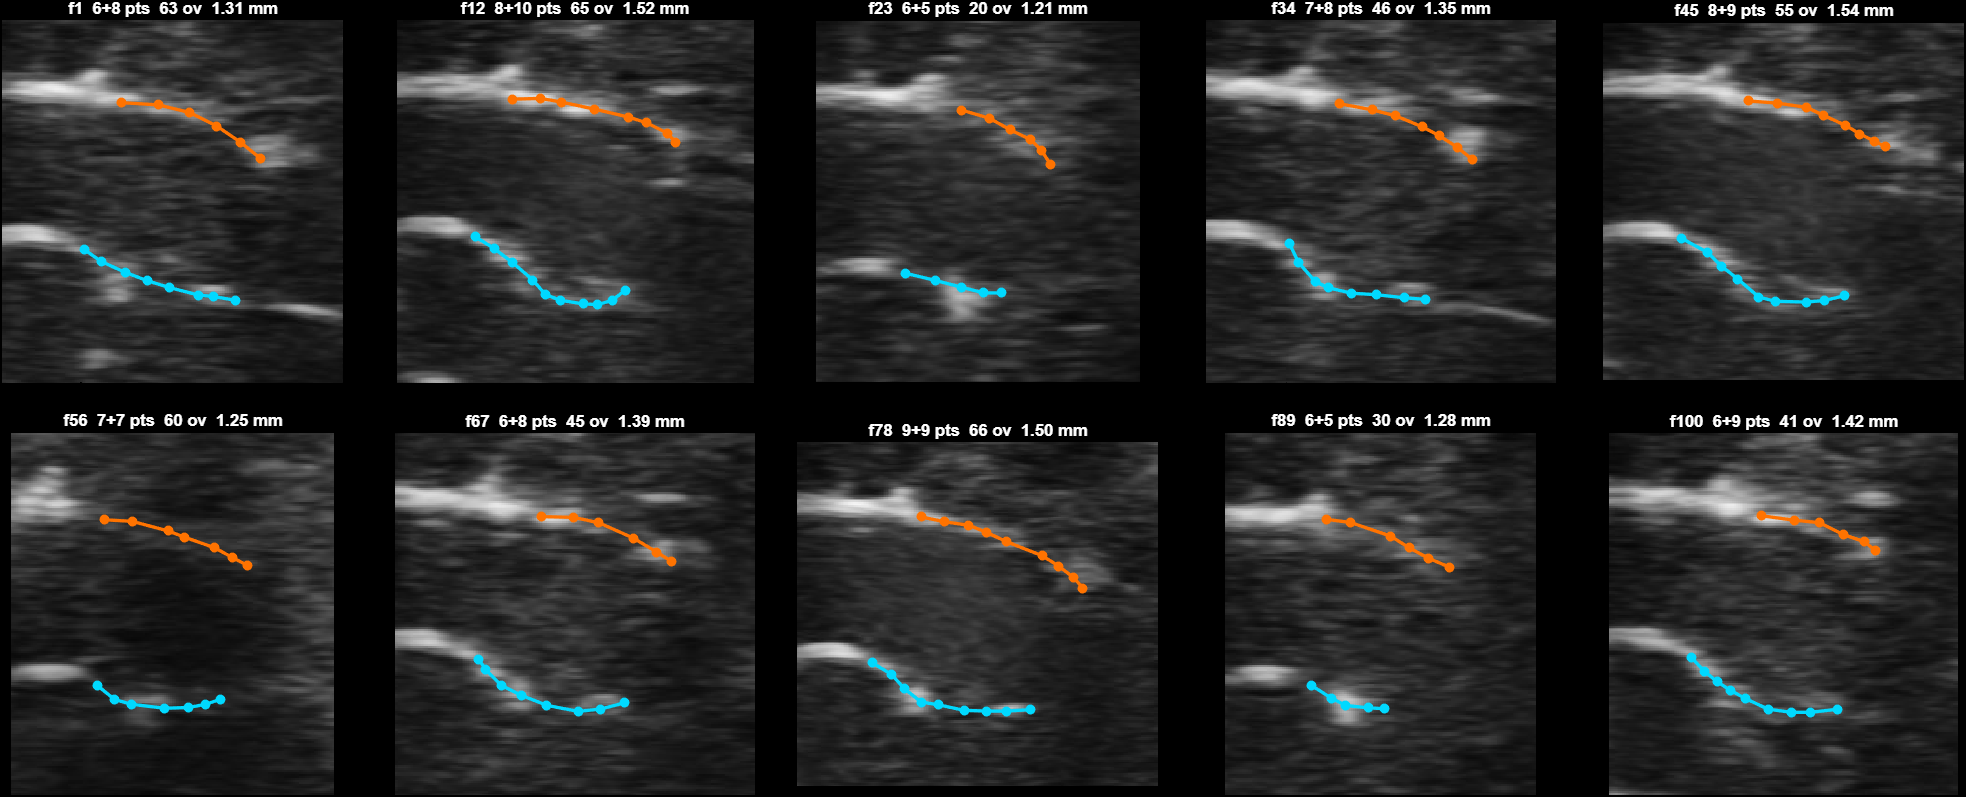
A contour drawn by hand is a person marking the two walls, so the gap between them is a reference. Ten frames were traced on each of two animals.
| first animal | second animal | |
|---|---|---|
| detector | 1.53 mm | 1.33 mm |
| hand-traced | 1.53 mm | 1.37 mm |
| difference | +0.4% | −3.5% |
| coverage | 95% | 90% |
Within 3% on both.
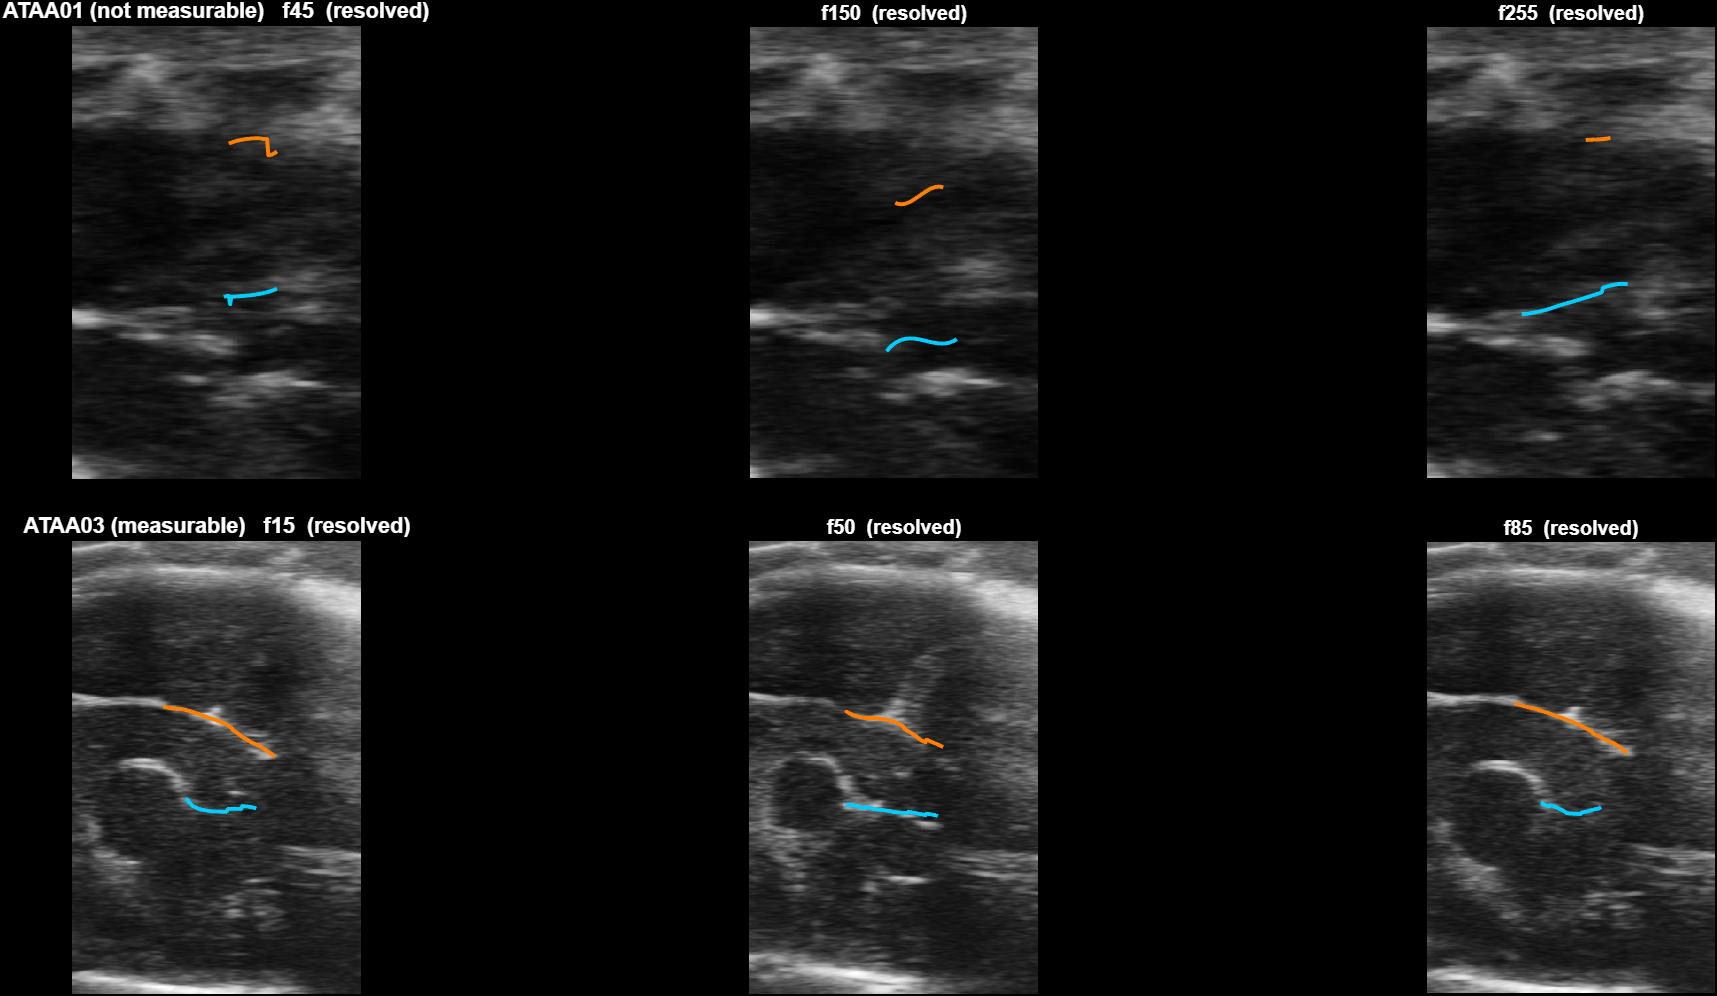
Here are the tracings everything rests on.
Not every clip can be read. On one animal the detector resolves only 40% of frames and correctly refuses.
4. Why strain failed, and why that was the wrong conclusion
What strain is. The aorta is elastic. Each heartbeat stretches it and it recoils. Cyclic strain is how much it stretches, as a percentage: widest diameter in a beat, minus narrowest, over narrowest. A healthy wall stretches a lot, a stiffened one stretches less, so a lower strain is worse, and that fall often shows before diameter itself changes.
The detector kept only about 44% of the traced swing, and it kept almost exactly that on both animals. A number that reproduces that closely is a mechanism, not luck.
Measured straight from the pixels, the heart beats once every 8 frames on both B-mode clips, 573 and 528 beats per minute. The filter that steadies the walls is a 5-frame median, so it spans two thirds of a heartbeat. Of course it flattens it.
Removing the filter does not help either. Unsmoothed, the same clip reports a 78% swing where the tracings say 24%. The noise is simply larger than the beat once you stop smoothing.
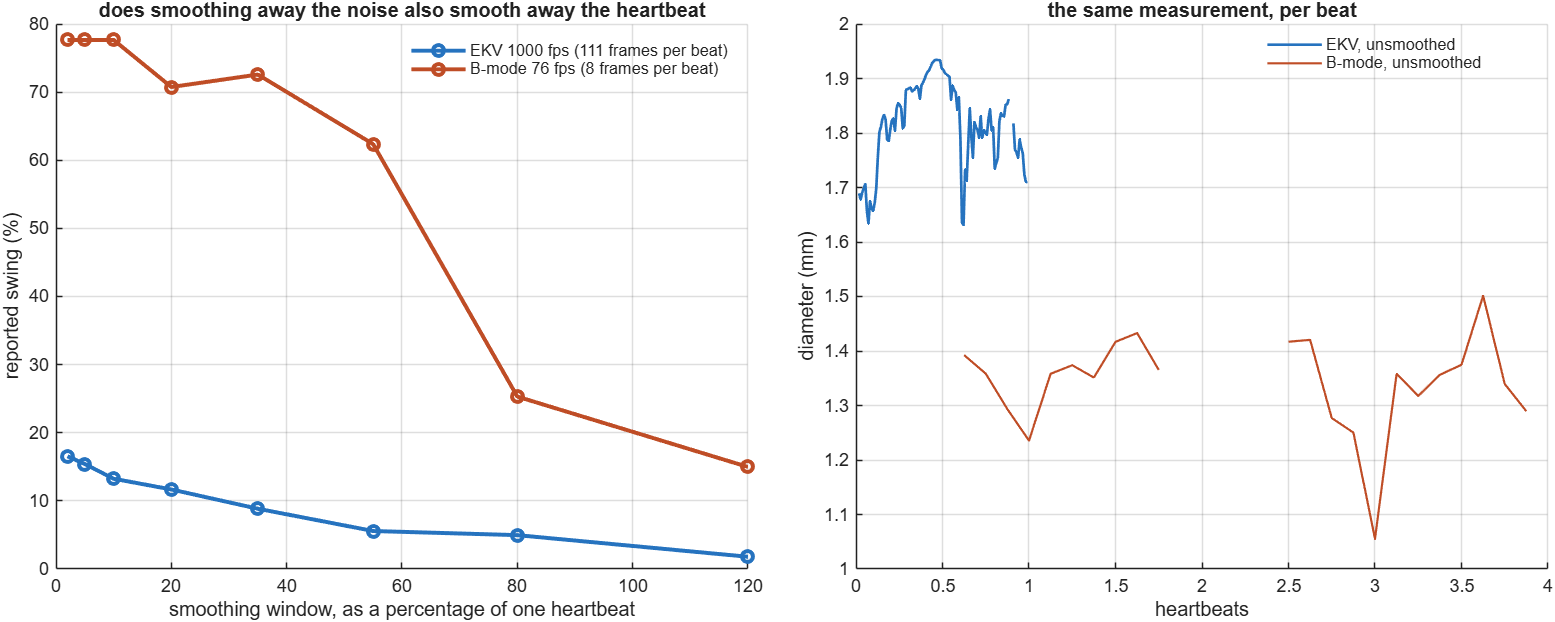
That is a sampling problem, not a fact about aortas. And the archive already contains clips that do not have it.
5. Each EKV clip is one heartbeat, measured 111 times
Alongside the B-mode clips there are 39 EKV recordings, every one at 1000 frames per second.
Both formats give about a hundred frames. The difference is how those frames are spent. A B-mode clip runs 1310 ms, which at this animal's heart rate is about twelve beats, so each beat gets 8 frames. An EKV clip runs 111 ms, which is one beat, so that beat gets all 111.
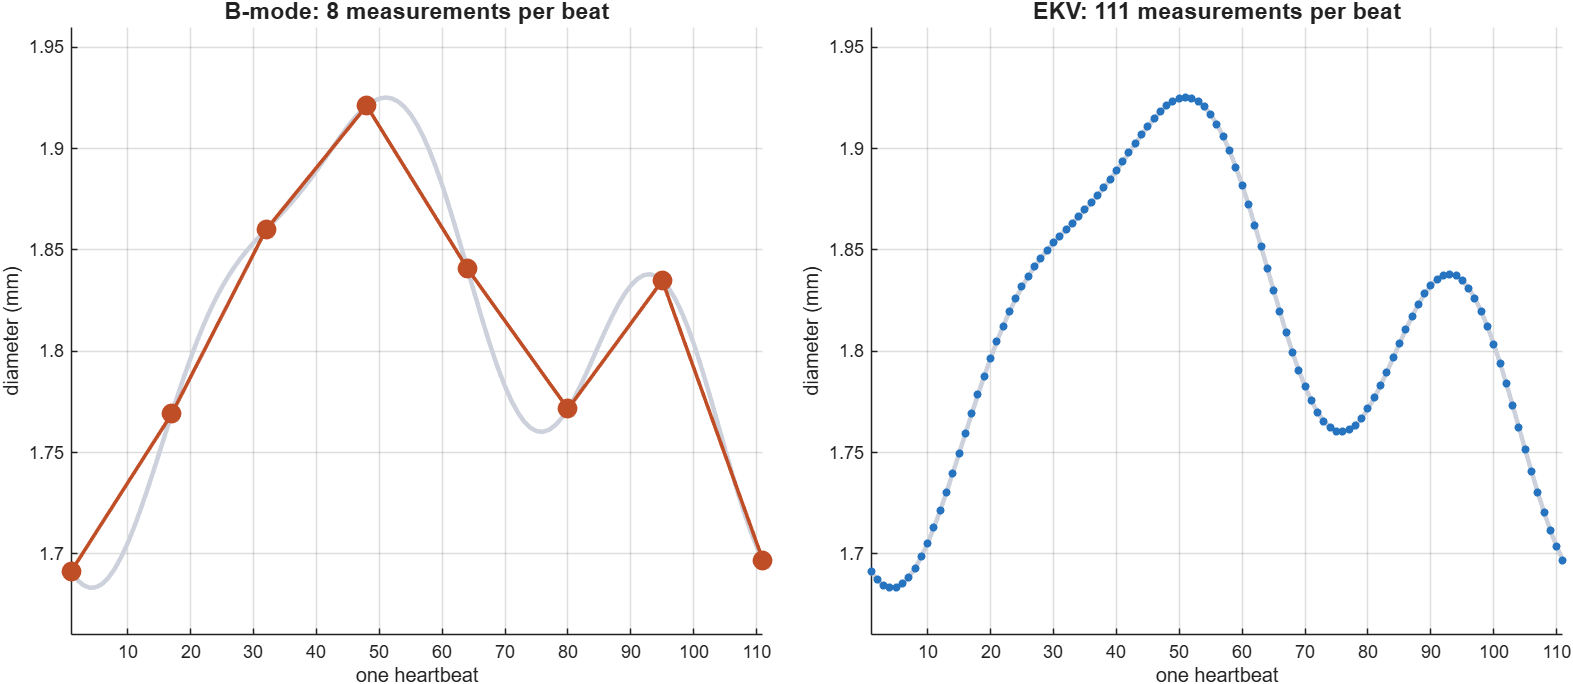
Each is one cardiac cycle, and that looks like a limitation but is not. Their lengths run 104 to 147 ms, which works out to 408 to 577 beats per minute if each holds exactly one beat, and all 39 land inside the range a mouse actually runs at. The frame count follows the animal's heart rate rather than how long the probe was held. That is the scanner compositing many gated beats into one clean reconstructed cycle, so a longer scan gives a better-averaged cycle rather than more cycles. One resolved cycle is also exactly what strain is made of.
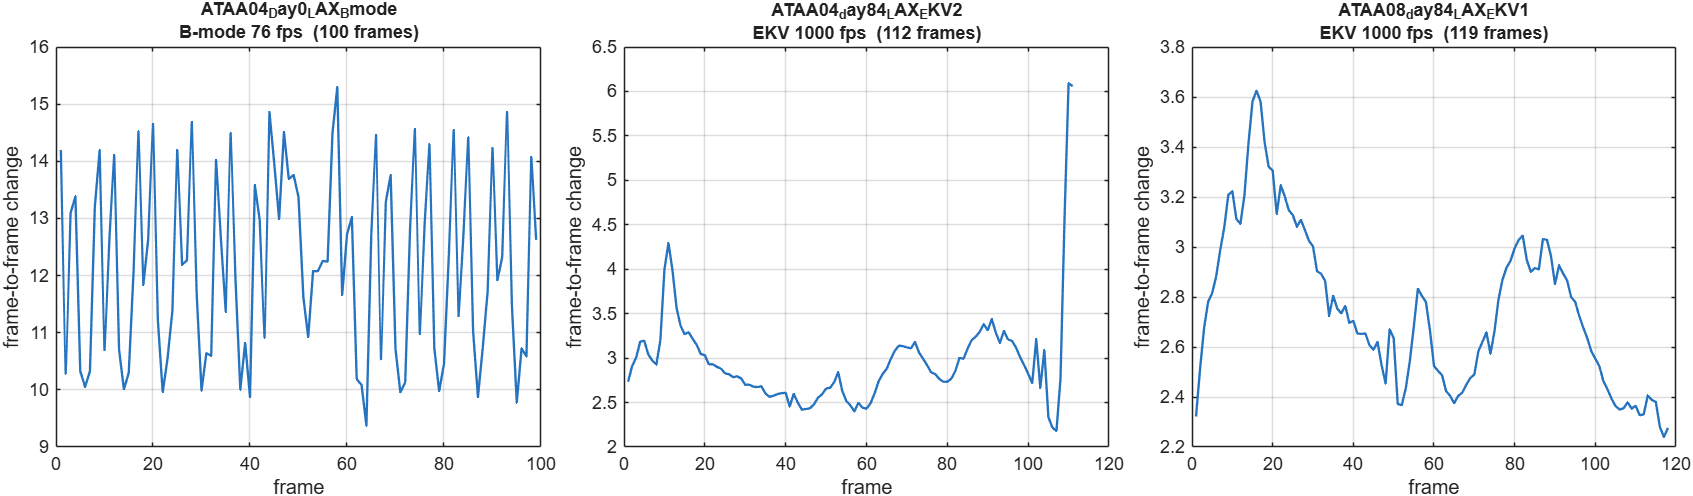
Not every EKV clip is readable, and the first one tried was one of the worst. Several are clear.
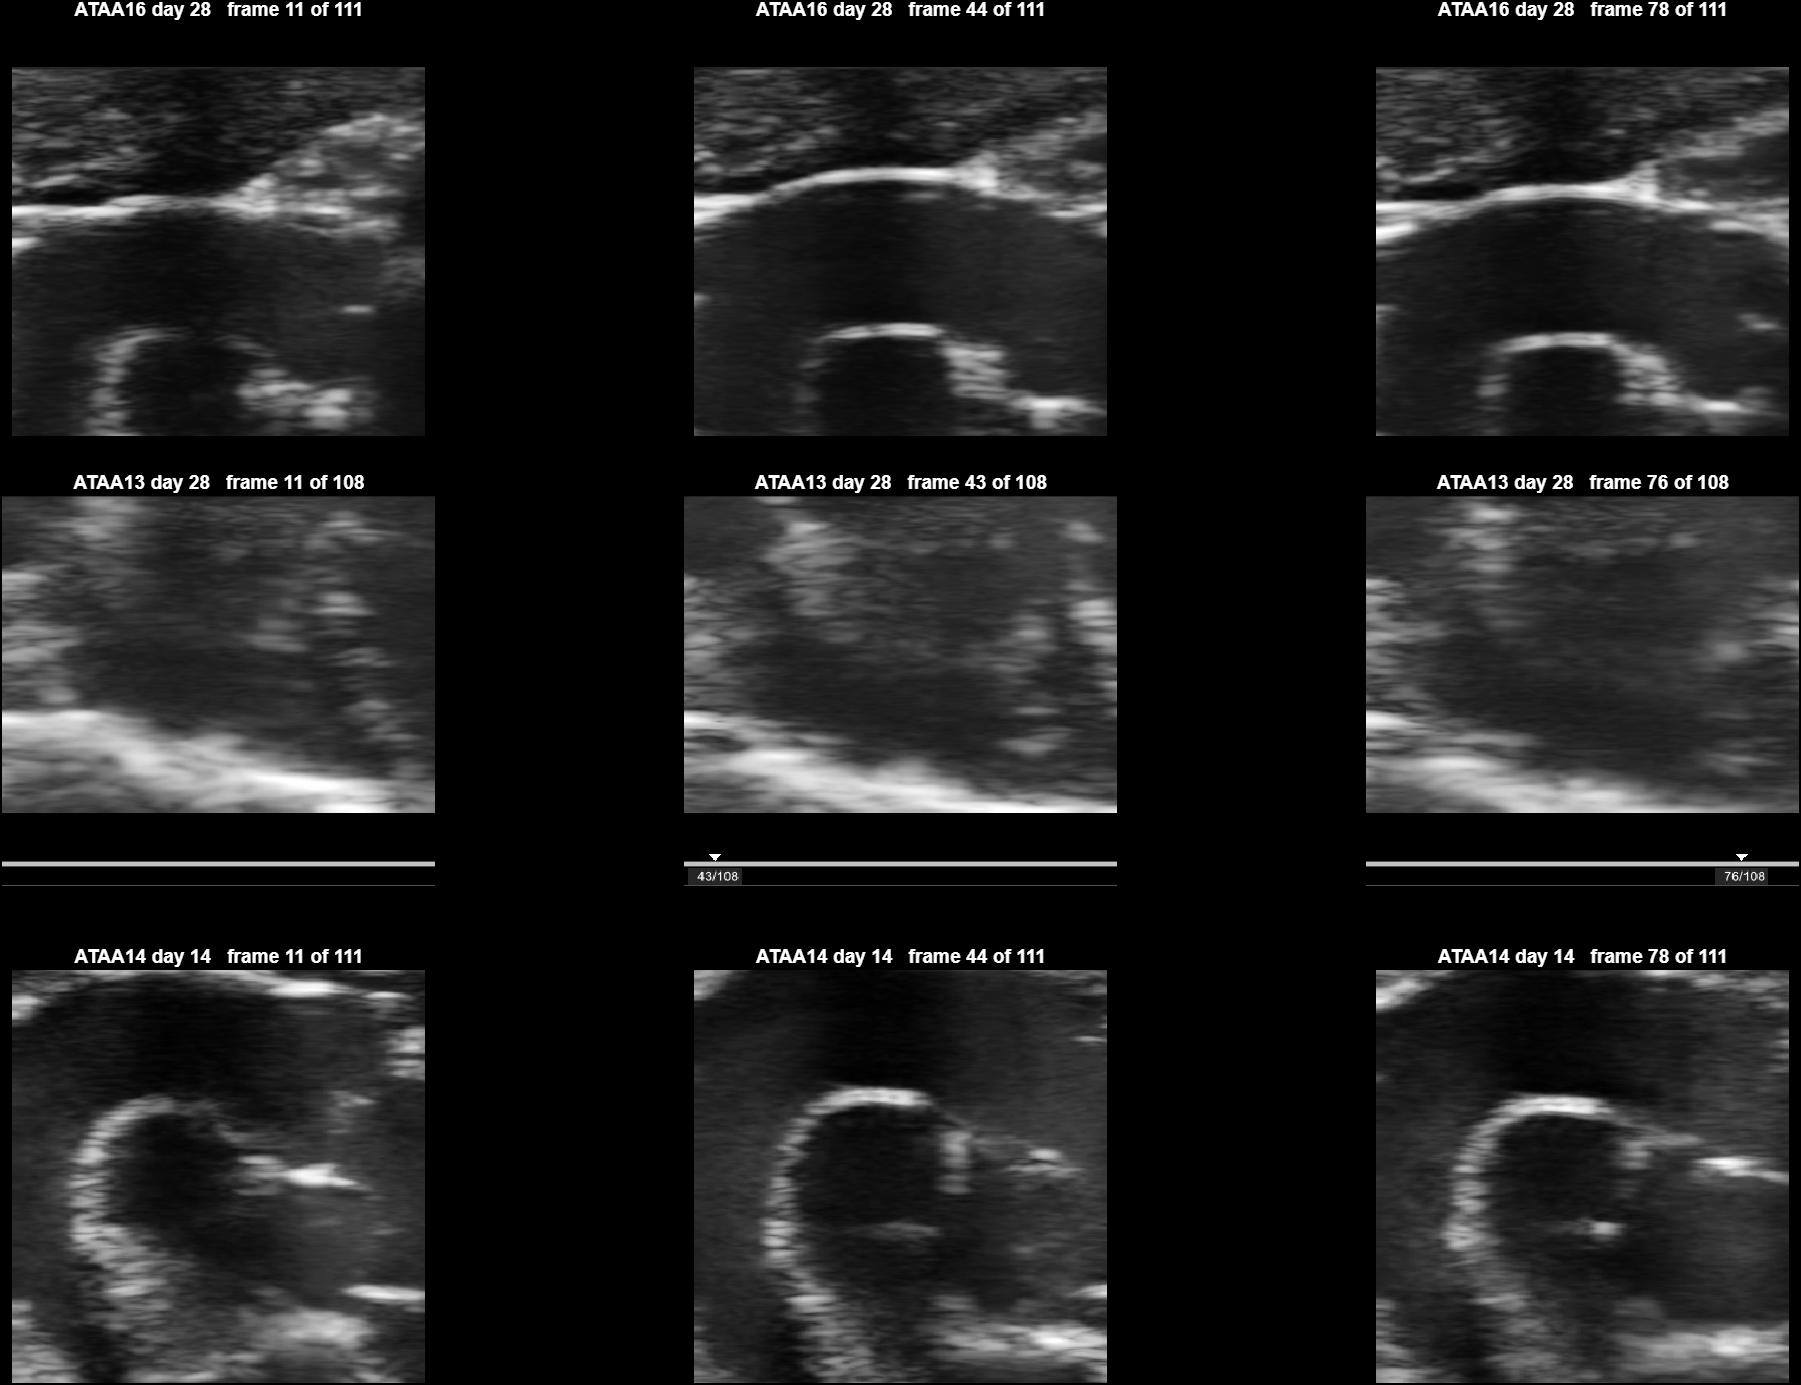
The result
One EKV clip was contoured and measured. 97% of frames resolved, the highest of any clip so far, and a median diameter of 1.81 mm.
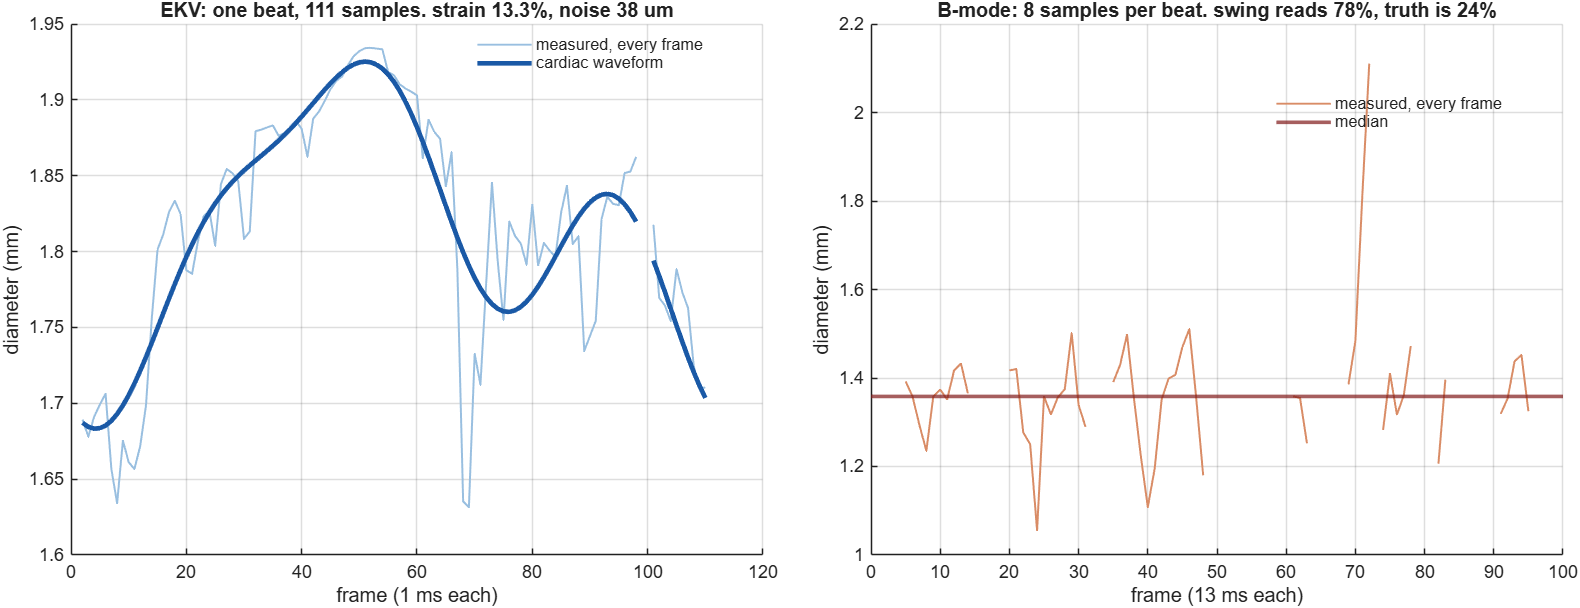
That left panel is the finding. The waveform is a real, smooth cardiac cycle.
It gives:
| value | |
|---|---|
| strain | 12 to 15% |
| noise around the waveform | 0.038 mm |
| beat size against noise | about 6 times |
On the B-mode clip the unsmoothed number overstates the known truth by 3.2 times. On the EKV clip the beat is about six times larger than the noise around it. That is the difference the frame rate buys, and it is not really about noise being lower. It is that with 110 samples per beat the heartbeat and the noise sit in different places, so one can be separated from the other. With 8 samples they overlap and no filter can tell them apart.
What this does not yet show. No EKV frames have been traced by hand, so the 12 to 15% has not been checked against a person the way the diameter figures were. The exact number also moves with how the waveform is fitted, which is why it is quoted as a range. The claim here is that a cardiac waveform is now visible and measurable, not that this particular percentage is validated.
6. What would move this furthest
Trace a handful of EKV frames. Five or six, at the widest and narrowest points of that waveform. That converts "a waveform is visible" into a checked strain measurement, the same way ten traced frames converted the diameter result.
Is there day-0 EKV? The EKV clips start at day 14 and run to day 168, so every day-0 scan is B-mode. If strain works on EKV it would be available from day 14 onward with no baseline. Whether that matters depends on the study design.
The lab's own measurements of these mice, from the scanner at acquisition or from tissue at endpoint. Everything here is agreement with a human reader tracing the same images. Only an independent measurement turns that into agreement with the animal.
Appendix: watching the detector work
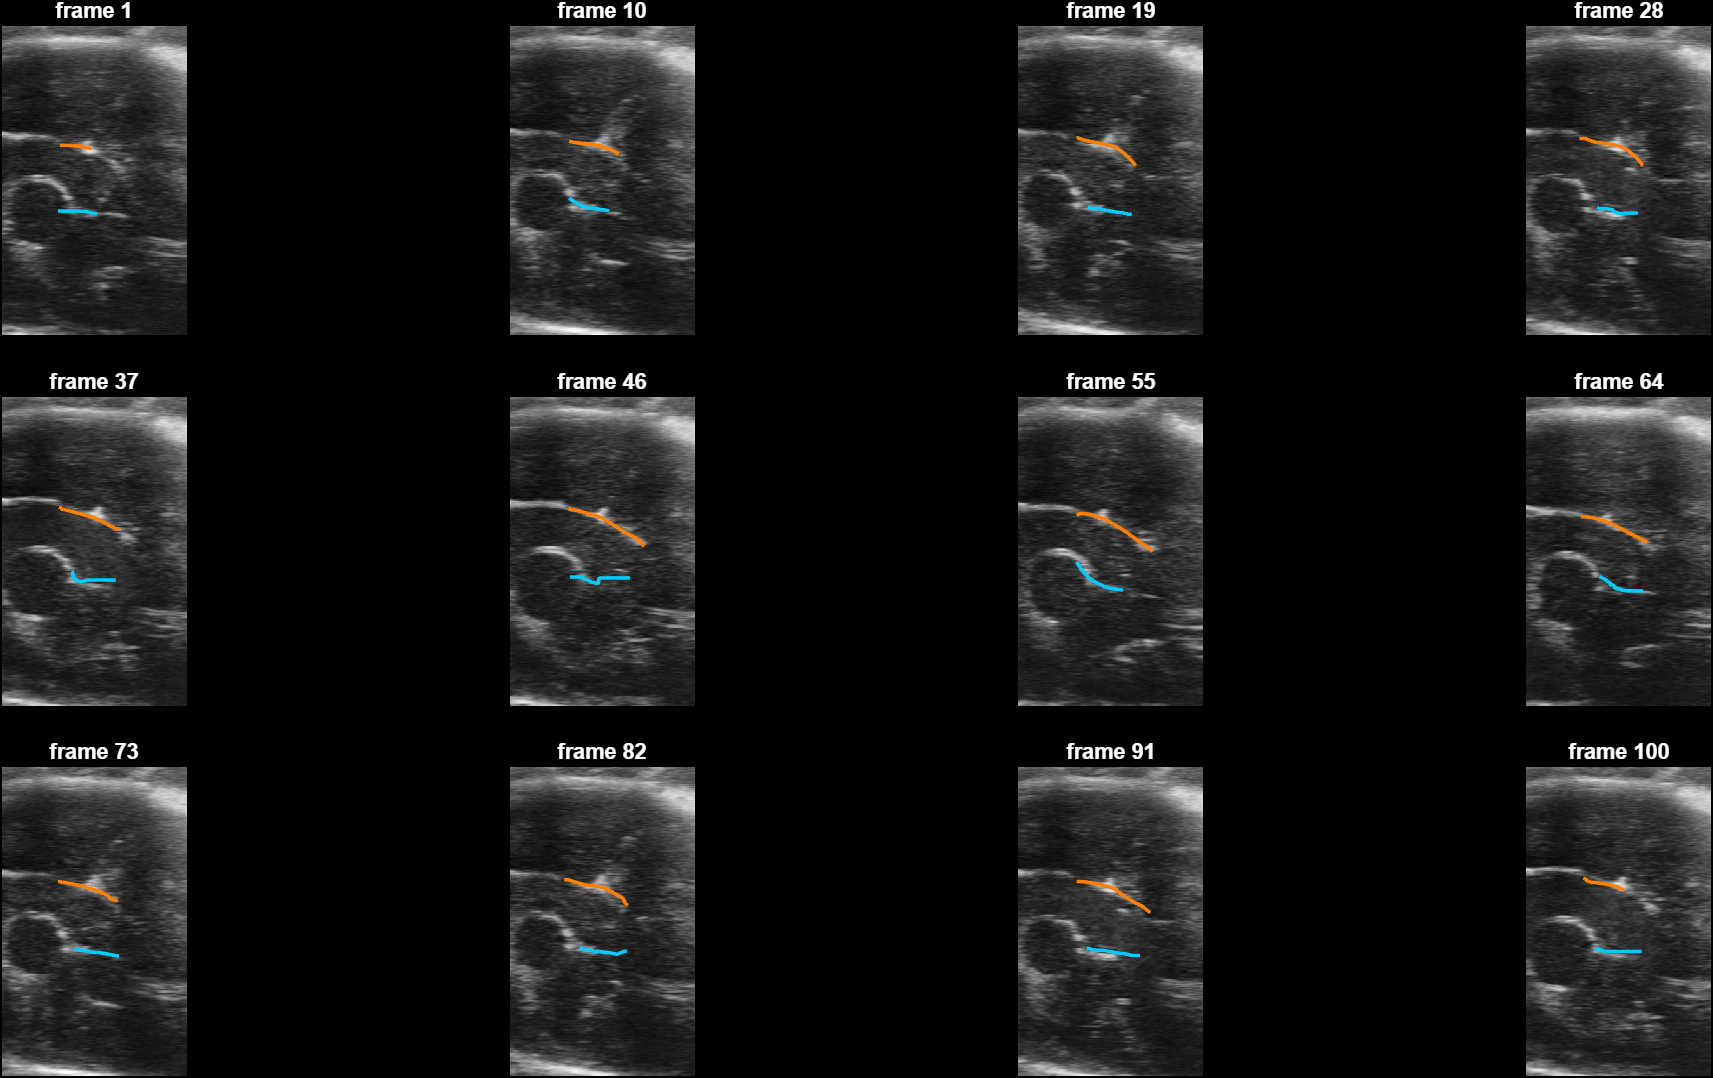
One method note. Detecting each frame alone and smoothing afterwards was compared against putting the continuity inside the search, finding each column's wall path through time with a penalty on movement. Across both animals the second resolves more frames and follows the beat much better, at a consistently worse mean level. Since the mean is what gets reported, per-frame detection stays the default and the other is an option.